
Benchmark Radar
Under reviewFind AI benchmarks with papers, code, datasets and scores
Built for AI researchers and model evaluators: filter LLM, agent, multimodal and AI-for-science benchmarks by date, source and score to compare evals quickly.
Built by Koutian Wu · Data & Analytics · Free
Coming soon on Launch Llama Tools
Benchmark Radar is a Community listing on Launch Llama with 0 total upvotes, founded by Koutian Wu who joined in Nov 2026, compared against 3 alternatives.
Community listing
Listing status
0upvotes
Community score
Koutian Wu (Joined Nov 2026)
Founder
Compared against 3 alternatives
Market comparison
Built for AI researchers and model evaluators: filter LLM, agent, multimodal and AI-for-science benchmarks by date, source and score to compare evals quickly.
About
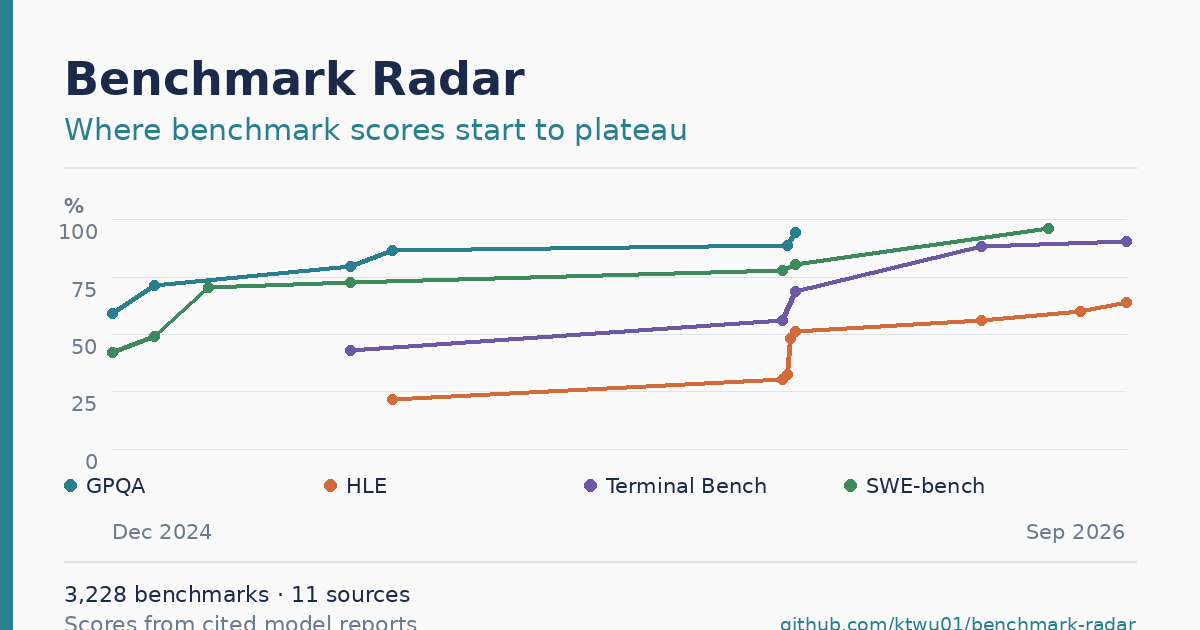
Each benchmark has its own page listing the paper, code, dataset and reported scores. A models grid puts models in columns and benchmarks in rows, so you can select any score to see its setting and source. The saturation views chart reported scores over time and rank benchmarks by a 30-day attention score built from GitHub stars and Hugging Face signals. Daily or weekly email briefings keep you up to date on new releases.
Follow Benchmark Radar: X (Twitter)
Key Features
- Search AI, LLM, agent, multimodal and AI-for-science benchmarks by time window and category
- Open a per-benchmark page with its paper, code, dataset and reported scores
- Compare models side by side against benchmarks in a shared score grid
- Track reported score history per benchmark to judge how close it is to saturation
- Rank recently released benchmarks by GitHub stars and Hugging Face attention
- Subscribe to daily or weekly benchmark update emails
Use Cases
- Finding which benchmarks have reported scores for a given model or task area
- Tracking newly released AI benchmarks and their attention over the last 30 days
- Checking whether a benchmark is nearing saturation by reviewing its reported score history
From the founder
Who it's for
“AI researchers, ML engineers and anyone choosing or tracking AI benchmarks and evals.”
Why I built it
“Benchmark Radar was built by Koutian Wu, a researcher automating scientific research, to make AI benchmarks searchable in one living database instead of scattered across many sources.”
Who it is for
- AI researchers choosing evaluation benchmarks for new models
- ML engineers comparing reported model scores across benchmarks
Pricing
Benchmark Radar is free to use. See the website for details.
FAQ
How to read this chart
Every value that could be read verbatim from a cited document, placed at the date that document was published rather than at any evaluation date. The line directly links actual observations that set a new reported record among the values shown; it neither holds a score between reports nor extends past the final record. Test versions and run conditions can differ, so this is a reported-record path, not a like-for-like trend. When no newer number could be read, the gap is marked rather than drawn through. Whether a benchmark has saturated stays a reading you make, not a score this panel prints.
What would it take to chart best score against lowest cost?
Two scores can only be compared when each one records which version of the test it used, which slice of it, whether a high number is good or bad, which model, what software ran it, how much thinking time it was given, what it cost, how long it took, when it was published, and where the number came from. The test and the way it was run have to match; the model, cost, time and date are free to differ, because those are what the chart compares. This site records that a model card mentioned a benchmark. It does not yet record those measurements. Once they exist, this chart could plot cost or speed against score, and draw a line through only the results that nothing else beats on both at once. A date slider would then show how that line moved over time.
What is Benchmark Radar?
Built for AI researchers and model evaluators: filter LLM, agent, multimodal and AI-for-science benchmarks by date, source and score to compare evals quickly.
How does Benchmark Radar work?
Each benchmark has its own page listing the paper, code, dataset and reported scores. A models grid puts models in columns and benchmarks in rows, so you can select any score to see its setting and source. The saturation views chart reported scores over time and rank benchmarks by a 30-day attention score built from GitHub stars and Hugging Face signals.
Who is Benchmark Radar for?
Benchmark Radar is designed for a range of users, including: • AI researchers choosing evaluation benchmarks for new models • ML engineers comparing reported model scores across benchmarks
What can you do with Benchmark Radar?
With Benchmark Radar you can: • Finding which benchmarks have reported scores for a given model or task area. • Tracking newly released AI benchmarks and their attention over the last 30 days. • Checking whether a benchmark is nearing saturation by reviewing its reported score history.
Alternatives
 LatticeFor AI researchers: Lattice tracks papers, trends, and breakthroughs across 20 labs daily with summaries, velocity charts, and weekly digests—no paywall.
More in Data & Analytics
New on Launch Llama
Launched this week · This month's launches · All products A–Z
Ask AI about Benchmark Radar
For bots & AI agents
Machine-readable versions of Benchmark Radar and Launch Llama. Fetch these instead of parsing this page.
This listing (.md) llms.txt llms-full.txt ai.txt Full catalog (.md) Endpoint index API docs MCP server MCP manifest Developer docs